Debugging
provides debugging capabilities in to identify and fix YAML, SQLite, and app problems and errors. Connect your phone using the debugging QR code to troubleshoot a solution directly from the . Quickly locate and resolve issues preventing the application from functioning correctly or as intended. Examine your code, write and test SQL queries in the debug tool, trace program execution, and analyze error messages or unexpected behaviors to pinpoint the root cause of the problem. You can improve an application's reliability, performance, and functionality by debugging an application.
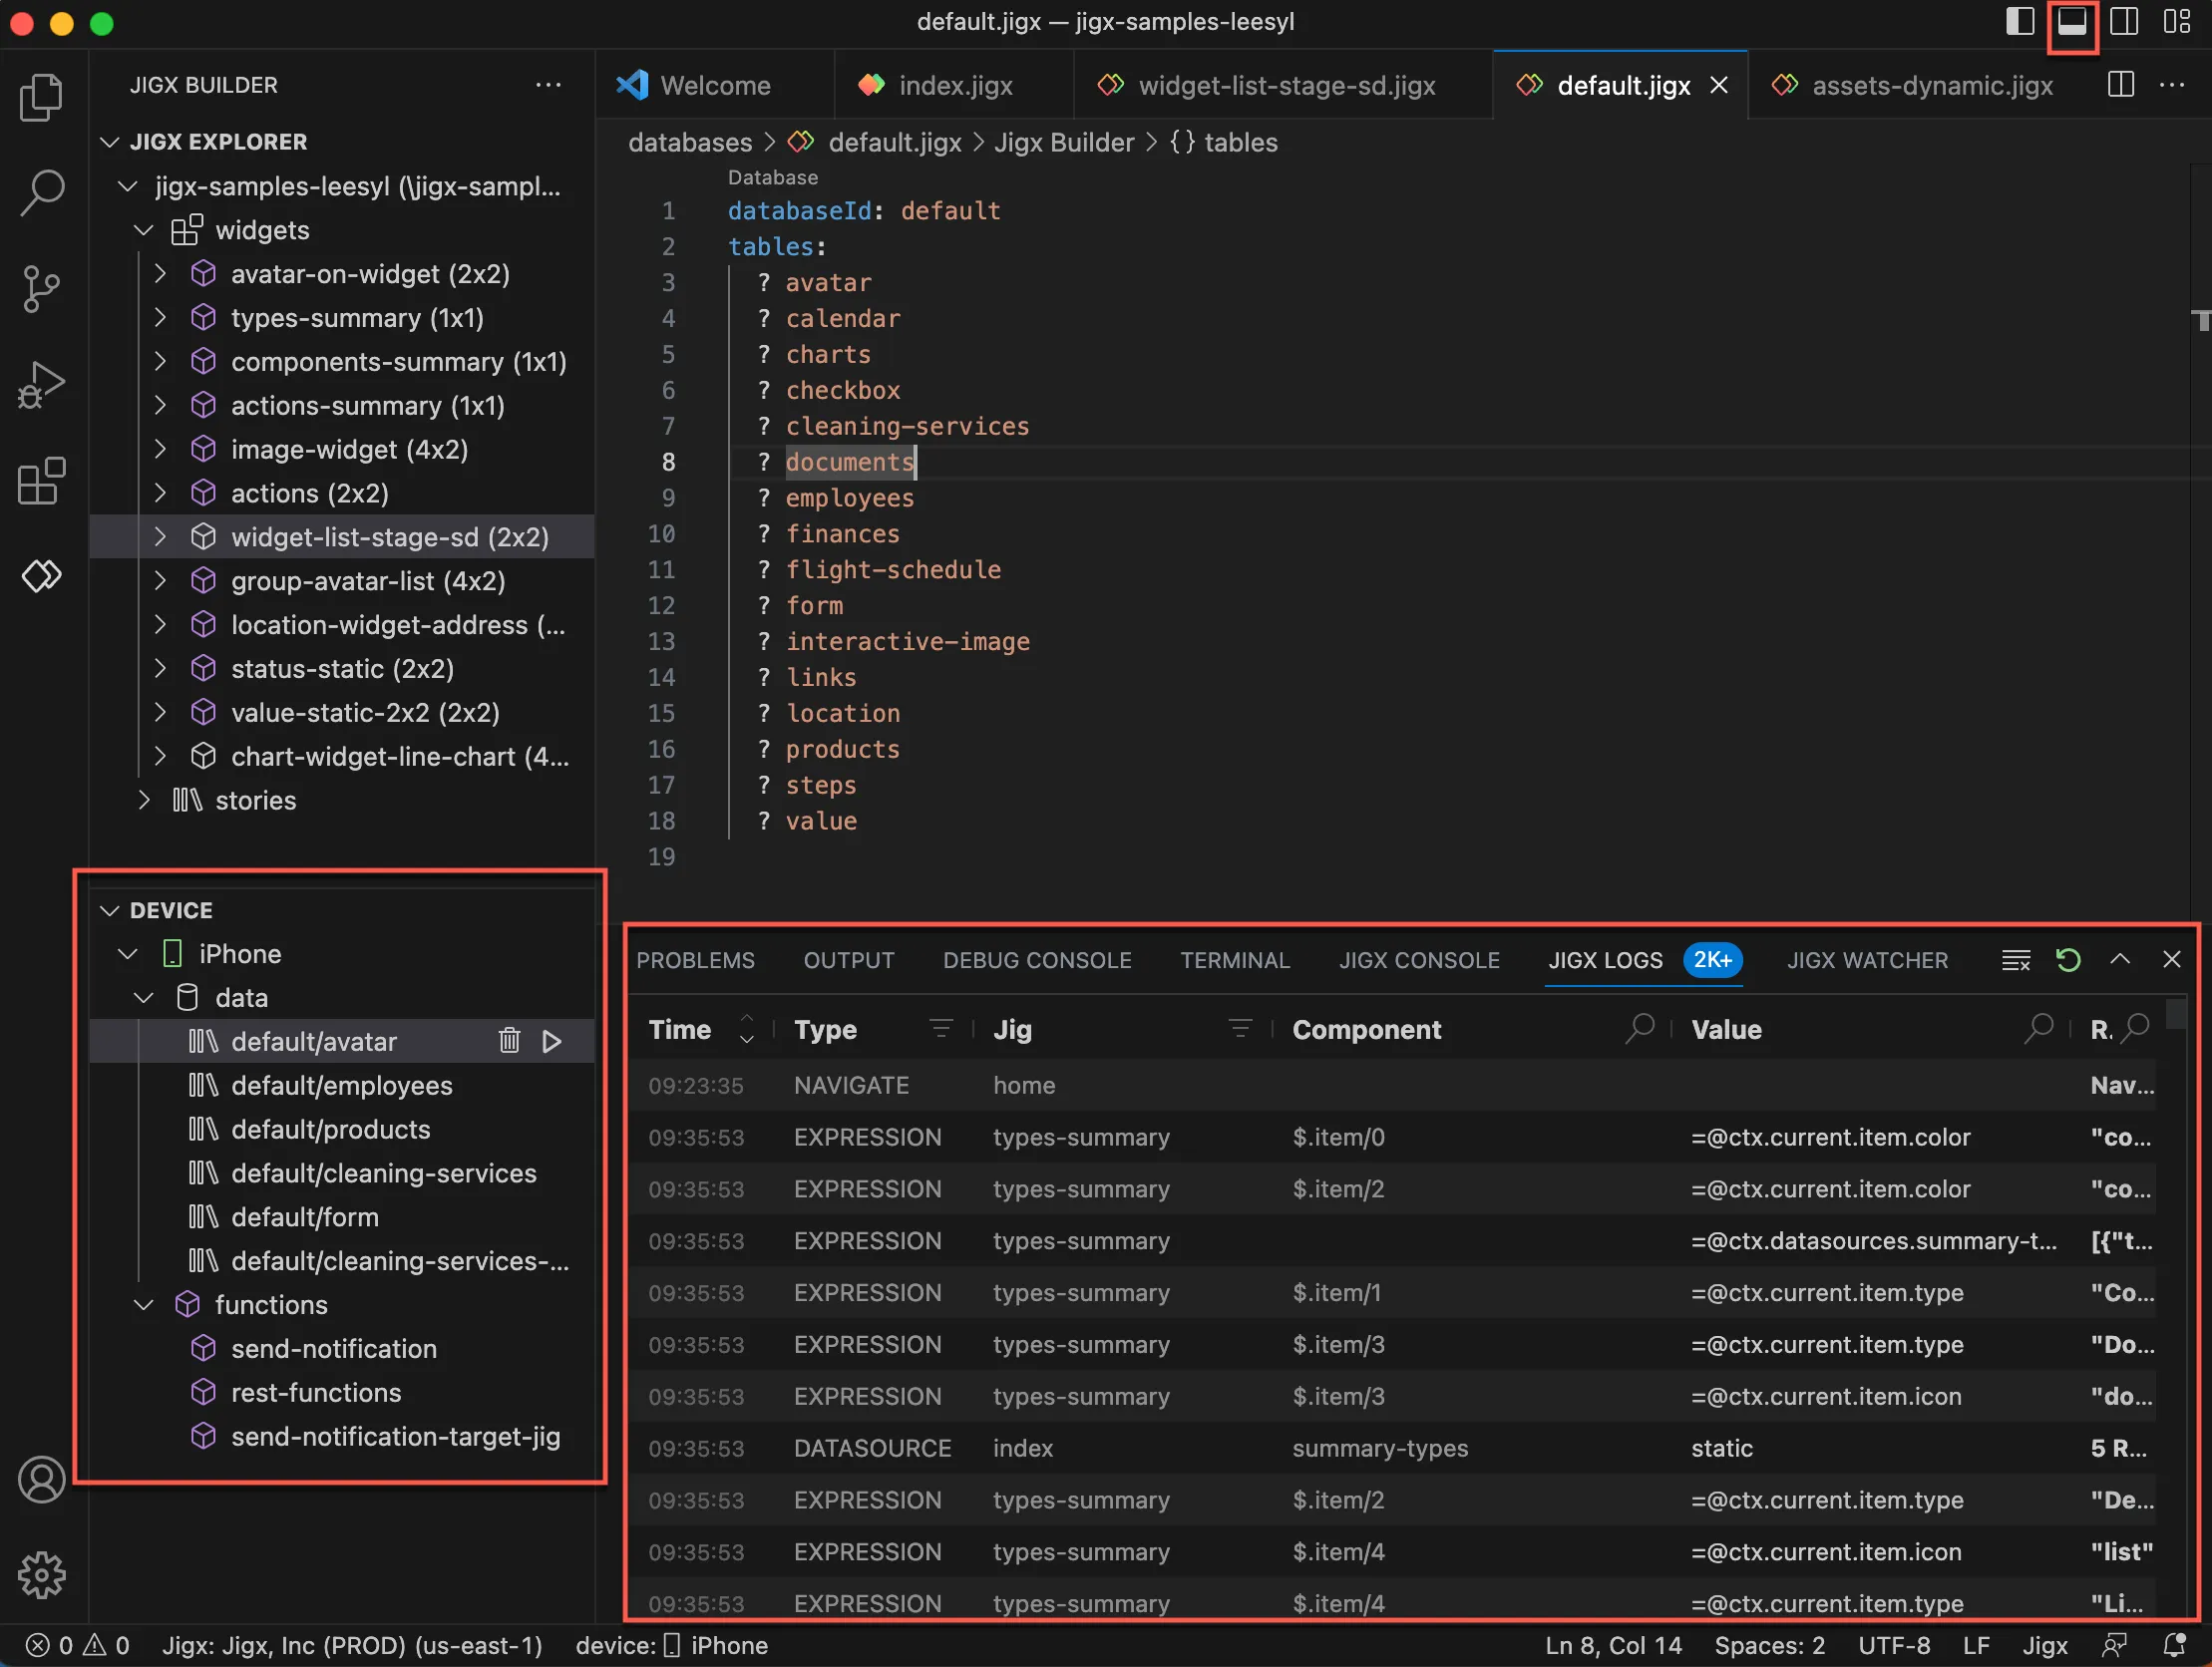
- Auto-sensing of code issues
- Detailed debug console
- Separate testing environment
- Hot reload to the connected device
- Live updates as code changes
Enable Dev Tools by following these steps:
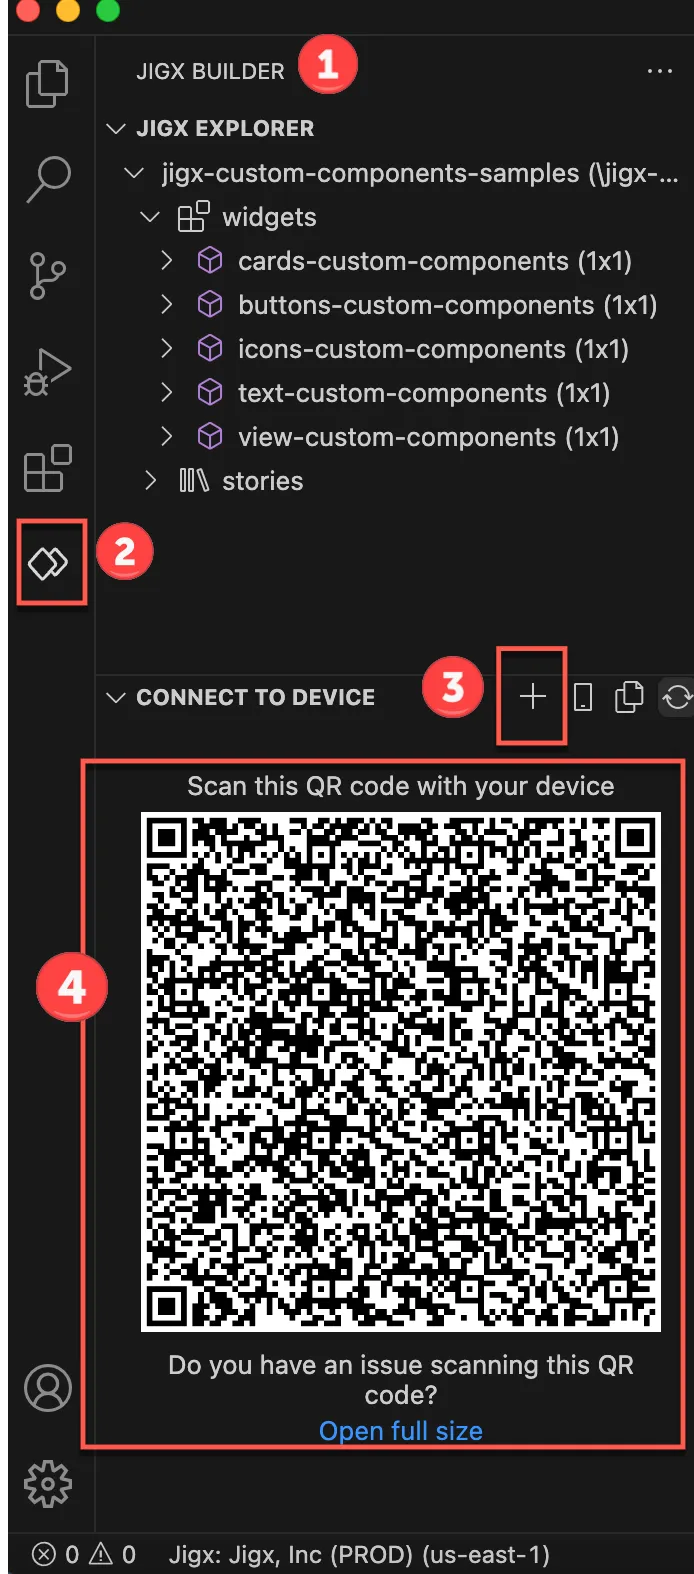
- Open the solution you want to debug in .
- Click on the icon in the activity bar.
- In the sidebar, click the + next to CONNECT TO DEVICE. Enter your user name and password if prompted.
- Now scan the QR code with your mobile device; you can open the QR code in full size if you having issues scanning the code. If you are using a branded app, see Settings to ensure the QR code is generated for the correct app.
- On your device, tap Enable on the Dev tools message.
- The solution opens in the .
- Your device will show in in the sidebar, with a data and functions node.
- Ensure that the panel is open.
There are four main tools in the Dev Tool set that specifically target debugging solutions. Each tool is described below:
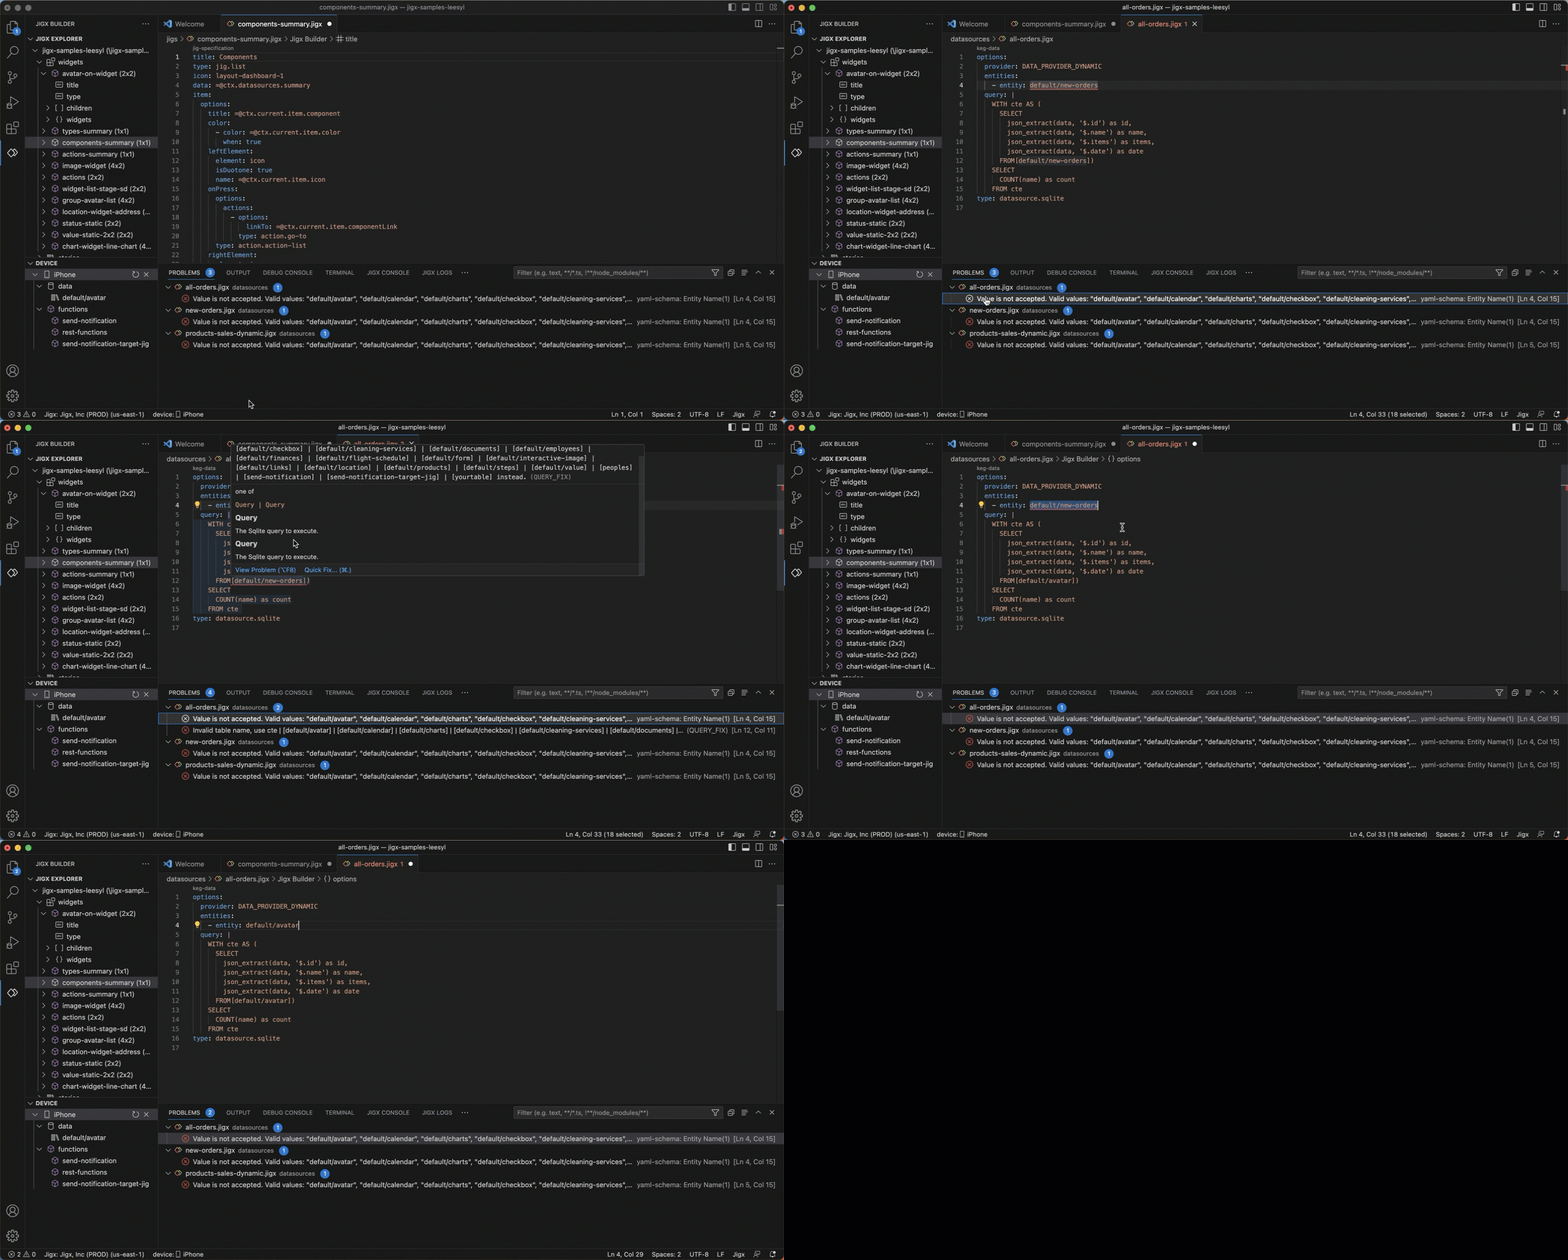
validates the structure and values in the .jigx YAML files and shows the issues that you need to fix in the Problems tab of the Dev tools pane.
- The pane shows the .jigx file, the area in the YAML that has the issue, and a badge count of the number of issues in that file, for example, all-orders.jigx datasources 2.
- Drill down into the list of issues to see the short descriptions and the location.
- Clicking on the issue will take you to the line of YAML code in the file.
- Hover over the issue to see the popup that offers validation assistance and a quick-fix link if applicable.
Use the Console to debug your data and functions.
Debugging data:
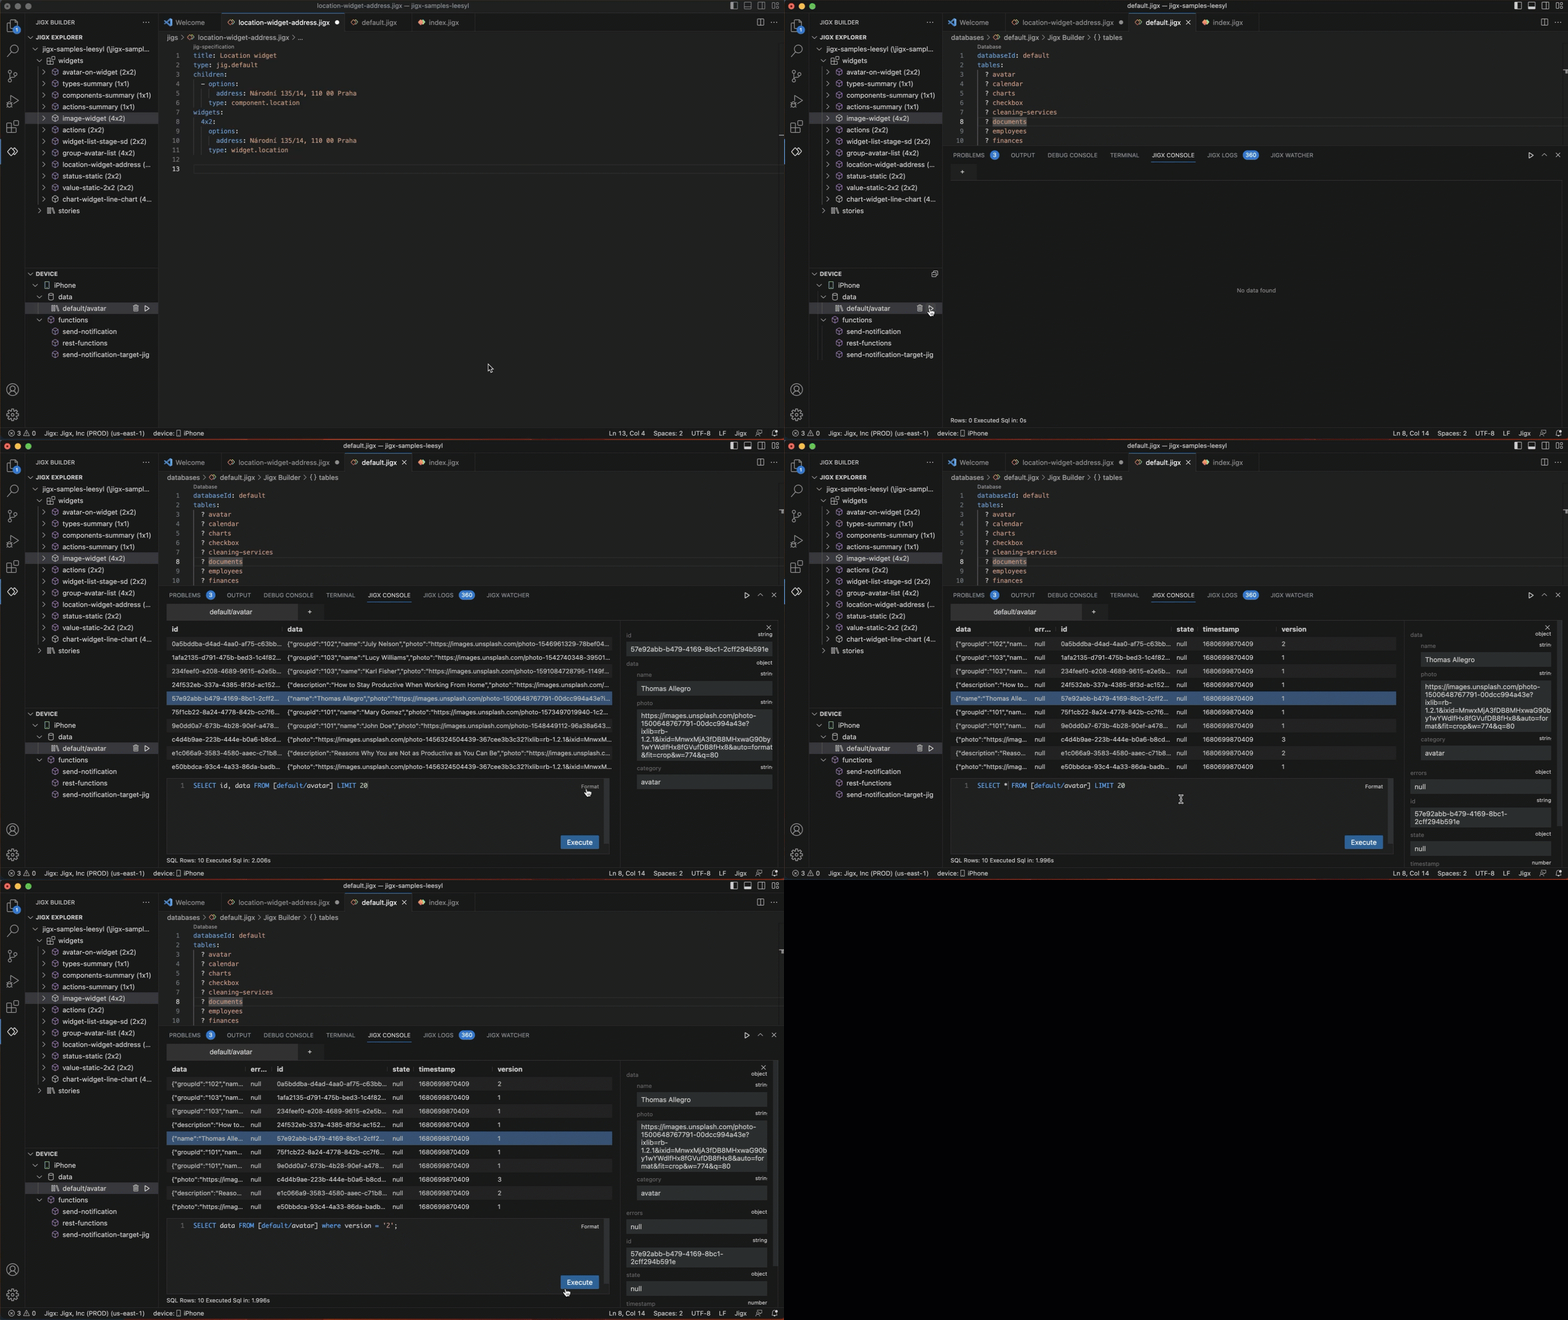
- Under the Device node, click on the data node and select the SQLite data table.
- Use the ▷ icon to run the SQL query in the Console.
- You can run multiple SQLite queries and functions simultaneously, as each one opens in a new tab in the console panel.
- The data table entries are listed.
- Drill down into the data entries by clicking on an item in the list, the data object is displayed in the right-hand panel.
- You can test your data by writing queries in the query editor and press the Execute button to test what is being returned from the SQL table. Once you have the correct SQL query, copy it to the or file where needed.
- Click Format to auto-format your query ready for copying into your YAML code.
Debugging functions:

- Under the Device node, click on the functions node and select the function to debug.
- The function.jigx file will open above the Console panel.
- Use the ▷ icon to run the function in the Console.
- You can run multiple functions and SQL queries simultaneously, as each one opens in a new tab in the console panel.
- The function parameters are shown.
- Click Execute to run the function and see the data in the console panel.
- Drill down into the data entries that are returned by clicking on an item in the list, the data is displayed in the right-hand panel.
- Click Clear in the right corner of the parameter panel to clear the parameters, to test your function parameteters add new values for the parameters and press the Execute button to test what data is being returned.
- Required parameters are indicated with an *
- The data type is shown next to the parameter, e.g., string, or array.
Logs records your interactions with the solution on the device when connected to the Dev Tools.
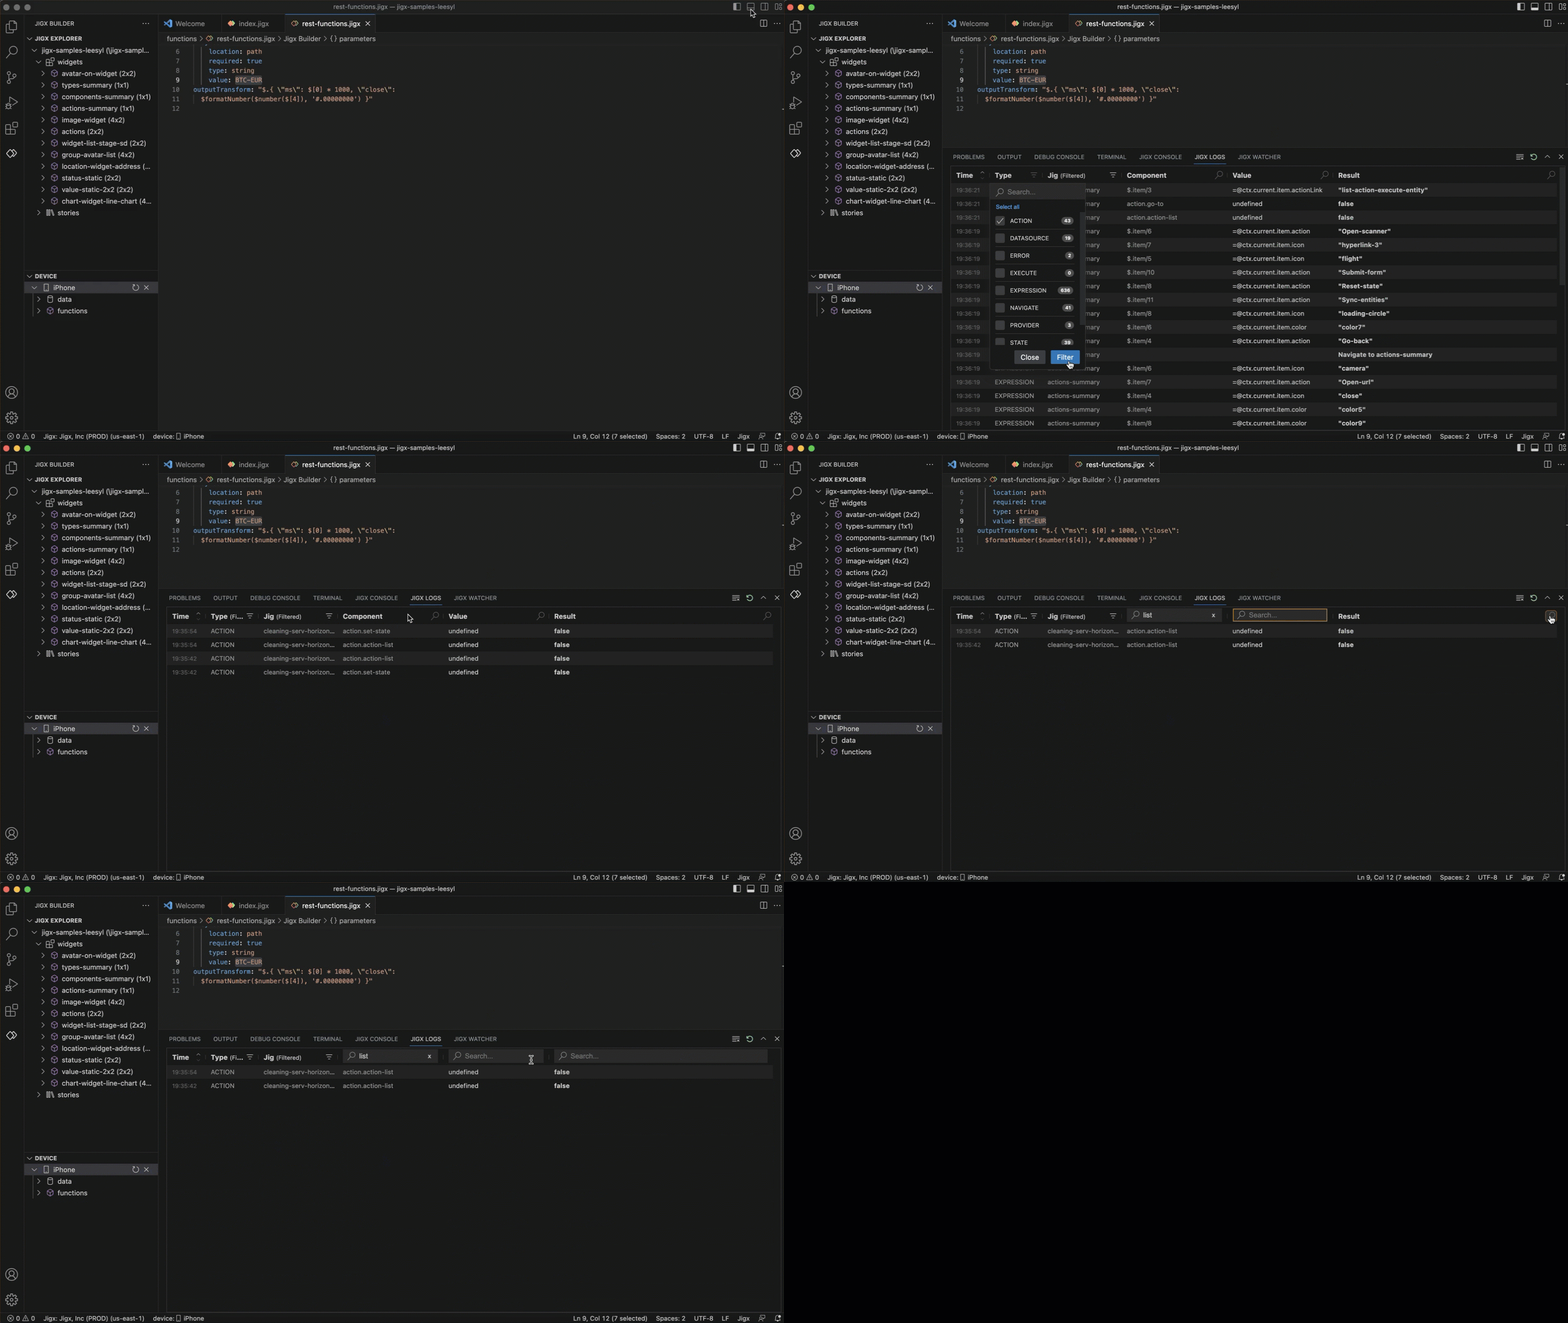
The following is logged:
- Datasource
- Error
- Execute
- Expression
- Navigate
- State
- Warning
Ordering- By default the oldest interaction is at the top, and the latest at the bottom. Order the list from latest at the top and the oldest at the bottom by clicking the up-arrow (⋀) in the Time column.
Filtering - You can filter by type or by , click on the filter icon next to Type or Jig. Select the options you want to display. The badges next to each option shows the number of entries in the log for that option. Once selected click the filter button.
Searching - All columns except Time can be searched using the search field.
Detail - Drill into each record by clicking on the item in the list. The full details for that item displays in the right hand panel.
Clear the log - Use the Clear logs icon to clear the log entries. As soon as you interact with the solution on the device while connected to Dev Tools the log will start populating again.
As you building out your solution in you can monitor expressions and SQL queries to see the results as you navigate the app on the device.
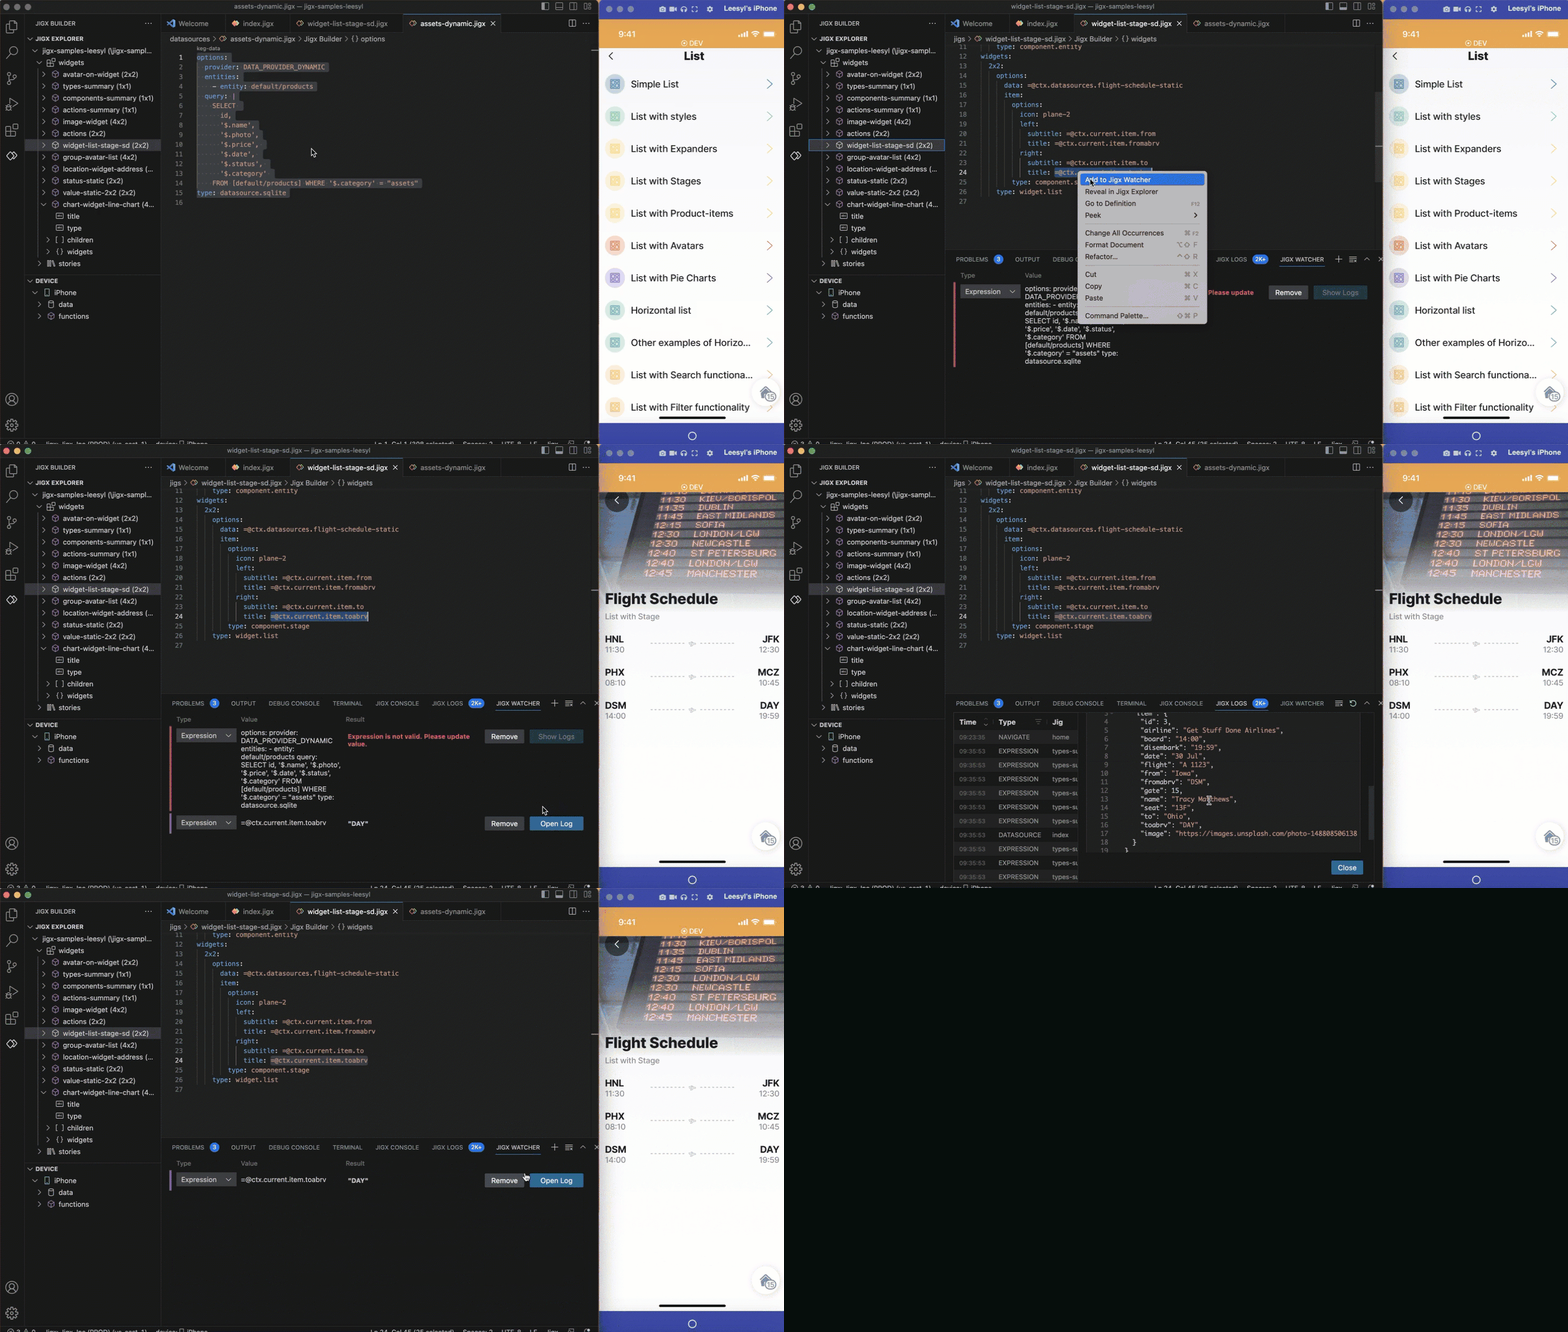
- Open a .jigx file in .
- Locate the expression or SQL query in the YAML code.
- Right click on the expression/SQL query and choose Add to Watcher. The Watcher opens in the panel below and shows the type, value and result. The result field is populated when you use the expression or SQL Query in a solution on your device.
- Use the Show logs button to open the entry in Logs and view additional detail for the expression/ SQL query.
- Use the Remove button to remove a single item. Click Clear in the right corner of the Watcher panel to clear all items in the list.
