| |
| |
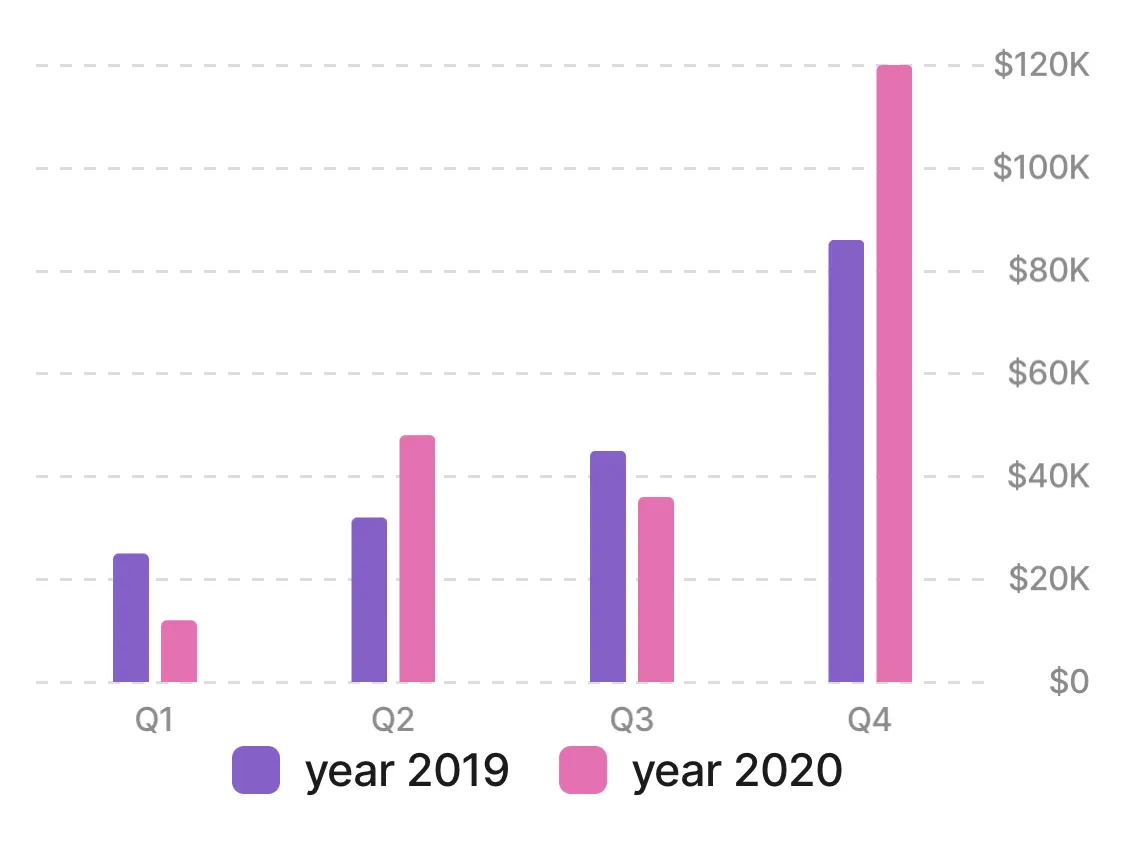
| isHidden - The setting of a boolean value if the legend (naming of the series) should be displayed under the chart. |
| Use plotbands to highlight specific regions or ranges on the chart, making it easier for users to interpret and analyze the data.
The from and to properties define the area to be filled with color. Specify the range using the from and to properties with numeric values.
color Sets the color of the band for the y-axis, choose a color from the provided color palette. |
| series - Different properties available to manipulate the data shown in the bar such as width of columns, the interval between two points, option to hide markers. |
| name - The naming of the actual series. |
| isFirstLabelHidden value is either true to hide the first label or false to display the first label. The property doesn't have to be defined, by default the first label is shown. isFirstTickHidden value is either true/false. Set to true hides the whole axis. isHidden value is either true/false. isLastLabelHidden value is either true to hide the last label or false to display the last label. The property doesn't have to be defined, by default the last label are shown. isLastTickHidden value is either true to hide the last line and label or false to display the last line and label. The property doesn't have to be defined, by default the last label and line are shown. labels - Label of axis, a selection of different formats such as dateFormat, currency, unit, and signDisplay are available. min and max - Minimum and maximum values that should be displayed on the x-axis. minPadding - When no categories set, a 1% space is made on the left and right of the chart so the id doesn't start on the left or ends on the right edge exactly. The default is set to 0.02 (x-axis) and 0.05 (y-axis). tickAmount - The number of ticks to display on the x-axis. The final amount doesn't have to be exactly the same number as you pass into it. Round up to 6 to give the chart a good set of numbers 0, 20, 40, 60, 80, 100. Set ticks to 3 will be honored and shows 0, 50, and 100.
|
| isFirstLabelHidden value is either true/false. Set to true hides the first label. The property doesn't have to be defined, by default the first label is shown. isFirstTickHidden value is either true/false. Set to true hides the whole axis. isHidden value is either true/false. Set to true the last label is hidden. isLastLabelHidden value is either true to hide the last label and line or false to display the last label and line. The property doesn't have to be defined, by default the last label and line are shown. isLastTickHidden value is either true to hide the last line and label or false to display the last line and label. The property doesn't have to be defined, by default the last label and line are shown. labels - Label of axis, a selection of different formats such as currency, numberStyle, compactDisplay and notation is available. minPadding - When no categories set, a 1% space is made on the left and right of the chart so the id doesn't start on the left or ends on the right edge exactly. The default is set to 0.02 (x-axis) and 0.05 (y-axis). min and max - Minimum and maximum values that should be displayed on the y-axis. tickAmount - The number of ticks to display on the x-axis. The final amount doesn't have to be exactly the same number as you pass into it. Round up to 6 to give the chart a good set of numbers 0, 20, 40, 60, 80, 100. Set ticks to 3 will be honored and shows 0, 50, and 100.
|